Our climate is changing. This is not breaking news — CO2 levels, global temperatures and sea levels are all on the rise, and so is our awareness of climate issues at Wellesley. With events like Sept.’s climate strike and movements like Renew Wellesley that call for fossil fuel divestment, the climate crisis has increasingly attracted attention on campus. Yet in the midst of this forward action, the science underlying climate issues often gets lost in the fray.
Before this semester, my grasp of our planet’s situation was limited to a vague sense of impending doom. Over the last few months, while interning for NOVA, a documentary series produced by WGBH, a public radio station located in Boston, my understanding came into much sharper focus. My main project has been fact-checking the soon-to-be-released “NOVA Polar Lab” — a digital interactive exploration of polar science aimed at middle- and high-school students. I have dug deep into the past of our planet’s poles throughout this process. Looking at Earth’s changing climate in context can make our current situation a bit simpler to navigate.
My fact-checking journey began by reviewing statements about the Arctic one by one. Ellesmere Island in northern Canada is a polar desert. Check. There are no trees there except for tiny two-inch arctic willows (Salix arctica). Check. Massive dawn redwood trees (Metasequoia) grew there during the Eocene 50 million years ago. Check. Alligators, turtles, tapirs and other swamp- and forest-dwelling creatures used to thrive in this landscape, which is now nothing but barren tundra. Check. I paused and took stock for a moment.
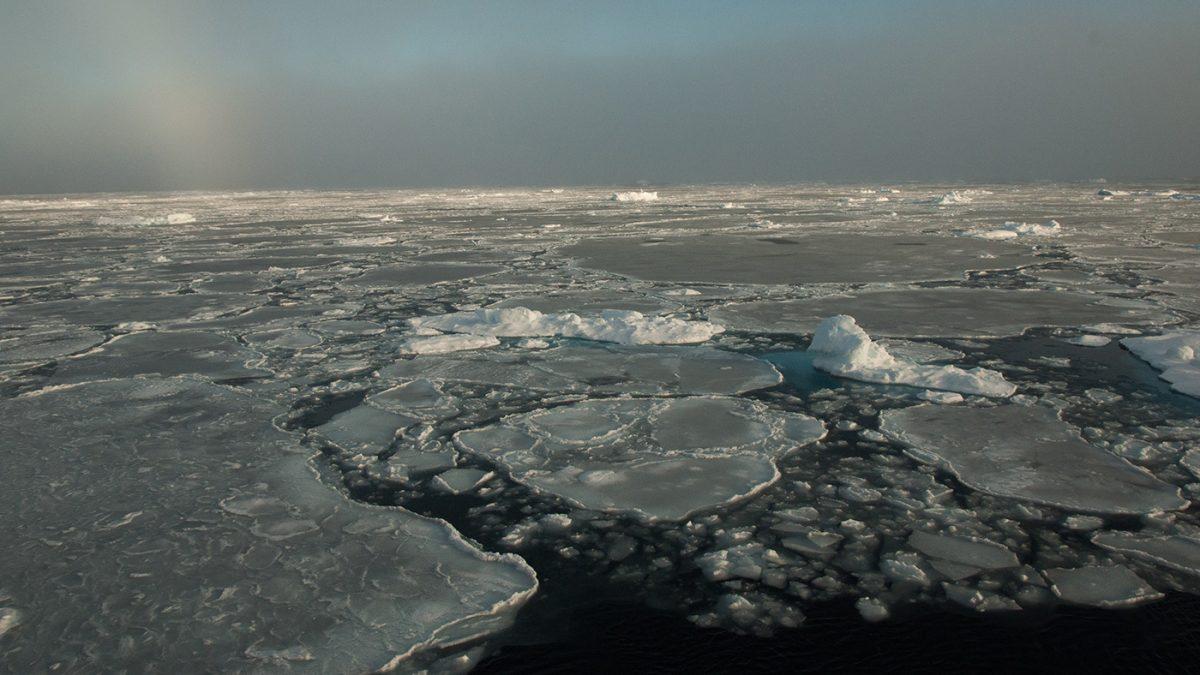
Clearly, the Arctic used to look much different than it does today. It turns out that during the Eocene — a time after the dinosaurs but long before humans — Earth was naturally a “hothouse” planet: a world without ice at the poles. Fossil evidence from Ellesmere and elsewhere reveals that swampy, warm, wet conditions dominated even the uppermost parts of the globe 50 million years ago. During this period in the far, far distant past, our world was unrecognizable. Its dramatic heat and monumental CO2 counts begin to tell us about the relationship between greenhouse gas concentrations and climate today — and what might be possible in the future.
To fully understand this relationship between CO2 and temperature, we need to look in the more recent history of “icehouse” Earth: the ice-capped Earth that humans have always known. While “hothouse” climate data is hard to come by, continuous records of our more recent past lie buried in lake beds and ice sheets.
As organic material settles at the bottom of lakes year by year, it forms information-rich layers. The resulting mud traps and preserves single celled organisms, fungi and pollen — each of which thrive under specific climatic conditions. For example, trees require warmer environments than grass, so scientists can measure the ratios of tree to grass pollen to reconstruct ancient temperatures. More trees signify a warmer climate, more grass signifies a cooler climate.
Similarly, when snow falls and builds up to create layers of ice, it traps air bubbles, which preserve samples of the current atmosphere, allowing researchers to determine how much CO2 filled the air at any given time.
By drilling deep into mud and ice, scientists essentially extract time capsules that help them recreate the climate history of the last few million years. Comparing ancient CO2 levels to ancient temperatures across time — matching up the contents of those frozen pockets of air to reconstructed climate estimates — reveals a clear pattern connecting the two measures: more CO2 means higher global temperatures. The records show that for the past 800,000 years, these levels have danced up and down together in predictable, natural cycles explained by Earth’s fluctuating orbit around the sun.
Until recently, that is. Over the last few decades, CO2 levels have shot up at a rate around 100 times faster than past natural increases. This increase, scientists agree, is due to human activity. Concentrations of the greenhouse gas now sit above a whopping 400 parts per million.
To predict what happens next, we can look back in the data to the last time Earth’s CO2 levels were this high: about three million years ago. This period — called the mid-Pliocene — was long before humans arrived, but much closer to today than the swampy Eocene. The mid-Pliocene was not a “hothouse,” but the world still looked different. Lake sediment data from above the Arctic circle shows high percentages of tree pollen from that time, suggesting forests blanketed areas that are now barren tundra. Differences like these were not just local to the poles. Global temperature estimates for the mid-Pliocene are about 3ºC warmer than current averages. The east coast of North America was mostly underwater.
While the underlying causes of these differences in temperature, ecosystems, and shorelines are far from one-dimensional, researchers look to this ancient warmer world as the closest analog we have for a near-future climate. Even though the recent rise in CO2 started a mere split-second ago on the geologic time scale, we are already seeing the effects. My fact-checking journey ended with lines like this: Inupiat people in Shishmaref, Alaska have to adapt their hunting methods as the ice around their village shrinks. Check. Weddell seal populations are declining in the fastest-warming parts of Antarctica. Check. If we keep emitting greenhouse gases at today’s rate, the world will look more like the world of the dinosaurs than the one we have always known. Check.
Knowing the science behind these changes allows us to better understand the danger of interfering with our climate system. My experience at NOVA this semester has shown me exactly what is at stake — and inspired me to work to keep our “icehouse” home frozen for as long as possible.


