
As this year’s seniors leave Wellesley, the News takes a closer look at the members of the Purple Class of 2026. In a survey to the senior class, the News asked seniors to reflect on all aspects of their time at Wellesley. At the end, the News asked the graduating class about their hottest takes on Wellesley. Throughout our analysis, we sprinkle in the graduating class’ opinions about dorms, social life, and self-censorship. Read the News’s analysis to learn more about how 124 seniors anonymously answered questions about academics, politics, romance, social life, post-grad plans, and Wellesley traditions.
Academics
Trends among major, GPA and honor code violations were similar to the previous graduating class. The class widely took advantage of Wellesley’s academic resources, including research, cross registration and study abroad.
According to the survey, the most common majors among respondents were Economics, Computer Science, and Media Arts Sciences. Economics was the most popular major, accounting for nearly 15 percent of respondents. Environmental Studies and Mathematics were the commonly reported minors, by 17 percent and 12 percent of respondents, respectively.
The average GPA of respondents was 3.75. Non-STEM majors reported a higher average GPA of 3.79, compared to an average GPA of 3.68 among STEM majors.
8 percent of respondents reported facing an honor code violation, academic or nonacademic. Out of the respondents who reported their experiences with the honor code, 17 percent of respondents reported cheating on an assignment by completing an individual assignment or exam with a peer, while 14 percent of respondents reported using generative AI to complete an assignment or exam where generative AI was not permitted.
78 percent of respondents reported participating in research. The most common forms of research were independent studies, at 27 percent, and working as a research assistant, at 26 percent.
55 percent of respondents reported cross-registering at another institution during their time at Wellesley. Among those respondents, 90 percent reported cross-registering at MIT, compared to 7 percent at Babson, 1 percent at Olin, and 1 percent at Brandeis.
53 percent of respondents reported studying abroad. Among those who studied abroad, the most common reason for doing so was the desire to travel, at 94 percent, followed by wanting to experience a different environment, at 91 percent.
Politics
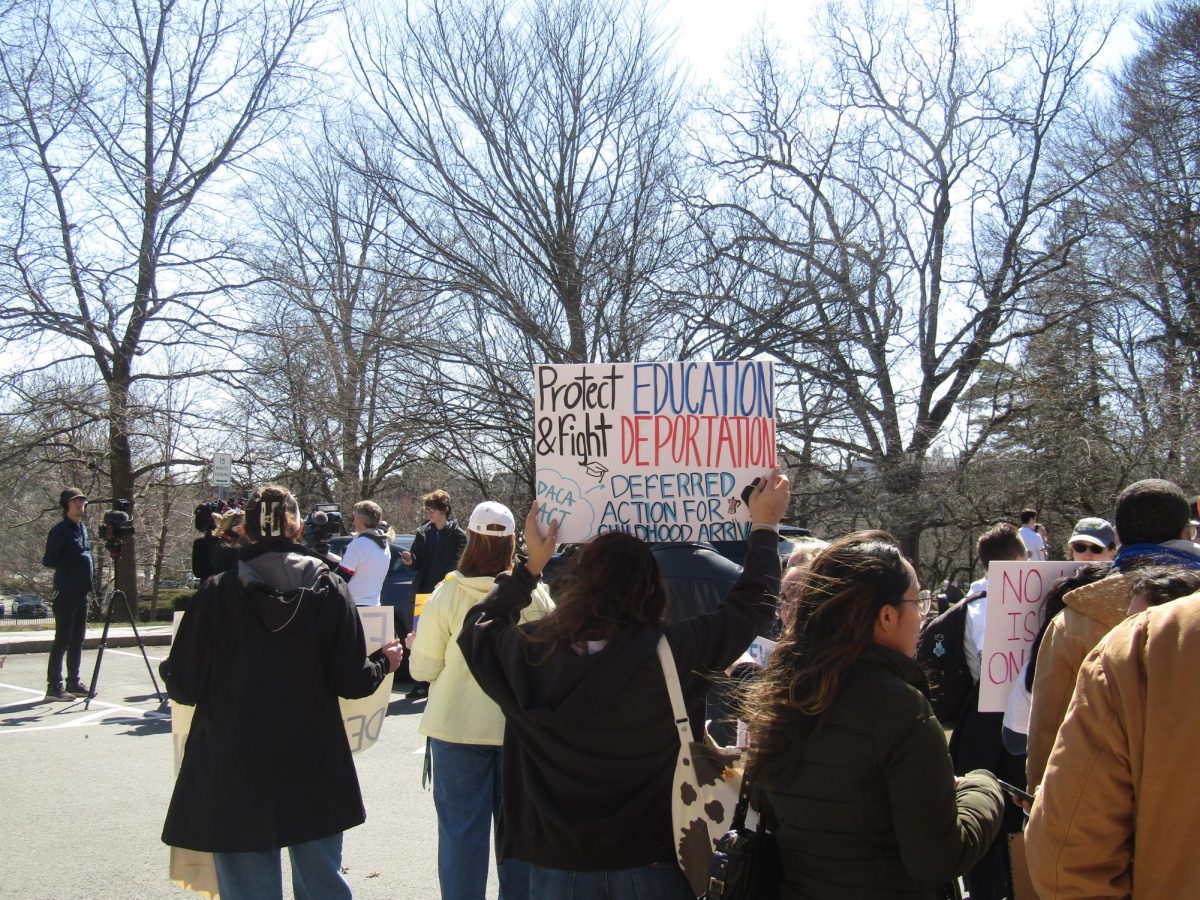
Over 80 percent of respondents indicated they “care” about politics, with nearly 50 percent indicating that they “extremely care.” Over their four years, the Class of 2026 experienced several moments of campus activism and change.
In the fall of 2023, their sophomore year, students at Wellesley protested for Palestinian liberation, following waves of protests at other U.S. institutions. In the spring of that year, students organized a sit-in after a statement from Johnson that affirmed Wellesley admits only those who “consistently identify as women.”
In their junior year, following over a year of negotiations, members of WOAW began a nearly month-long strike in March 2025.
These events shaped a graduating class that is highly politically engaged: nearly 77 percent of the News’ 2026 graduation survey respondents reported participating in at least one protest during their time at Wellesley. In a similar vein, nearly 70 percent of survey respondents reported dissatisfaction with senior administration.
Nearly 90 percent of respondents indicated they were either “progressive” or “very progressive,” with respondents indicating they were “very progressive” by 8 percentage points* more. This statistic follows last year’s survey and a survey conducted during the 2024 election cycle, where nearly 90 percent of students indicated they voted for Harris.
Since coming to Wellesley, 42 percent of respondents indicated their political perspectives changed. 82 percent of those respondents reported becoming more progressive and 13 percent said that they became more apolitical. Less than 5 percent said they became more conservative.
In their hot take, one senior said that “we are too progressive sometimes” and another said that “Wellesley is an echo chamber, especially politically.” A third respondent noted that “too many people go here thinking the[y’re] woke and have a right to take up space in places where they shouldn’t.”
Over 85 percent of respondents indicated that they have self-censored in some capacity during their time at Wellesley. Many participants indicated self-censoring in multiple places, the most prevalent answer being “in class,” at 44 percent.
Several members of the class of 2026 critiqued Wellesley’s “cancel culture,” “bubble,” and lack of “political pluralism” in their hot takes. One respondent said that “sometimes we need to touch grass and be a little more in touch with reality and less living in our delusional bubble (as safe and lovely as it is).”
Another respondent said that “for being a historically women’s college, when it comes to female empowerment a lot of women are still very scared to speak their minds out of fears of having takes that will get them cancelled.”
There has been at least one protest each year throughout the seniors’ four years at Wellesley. 76 percent of students indicated participating in at least one protest, while most respondents attended at least three protests, at 27 percent. The most attended protest was the WOAW strike, at 25 percent, closely followed by Israel-Palestine-related protests, at 24 percent.
Overall, 47 percent of respondents indicated that they were somewhat dissatisfied with senior administration. Those who have been to protests were more likely to be dissatisfied with senior administration, making up 86 percent of those who were dissatisfied.
Love, Romance, and Relationships
How was love life at Wellesley for the Class of 2026? This year’s class largely followed trends for romantic relationships from last year. Although most respondents reported being romantically involved in some capacity during their time at Wellesley, most are graduating single.
73 percent of respondents identified as LGBTQ+, with 80 percent realizing their sexual orientation before they arrived at Wellesley. This follows a similar trend from last year’s survey, where nearly 70 percent of respondents identified as LGBTQ+. In their hot take, one senior wrote about their qualms with labels at Wellesley.
“For a space that preaches liberation from social norms/expectations, there is a lot of pressure to put yourself in a bucket. It can be rough navigating what label you’re supposed to belong to if you are an individual who is queer/open to exploring but not confident enough to say that in the moment,” one senior wrote.
80 percent reported having romantic relations during their time at Wellesley. 77 percent had fewer than five romantic or sexual partners while at Wellesley, with nearly 40 percent of those respondents reporting 2 to 4 partners. 20 percent of all respondents had no partners. In the seniors’ hot takes, two respondents wrote that “people need to have more sex.”
Seniors were 27 percentage points* more likely to be romantically involved with other Wellesley students than with students from MIT or Harvard. Still, 18 percent of respondents reported romantic involvement with MIT or Harvard students, reflecting a long-standing stereotype for Wellesley students.
Even though about 70 percent of respondents identify as LGBTQ+, nearly half of the respondents said they never had any romantic relations on campus.
Nearly 60 percent of respondents are graduating single. For those that are not single, 36 percent are dating, 3 percent are in “situationships,” and one respondent is engaged.
Respondents are nearly split in half on where they met their partner. 48 percent met their partner on campus, while a slightly higher 52 percent met their partner off campus.
The most common way respondents met their partners was through mutual friends, regardless of whether the relationship was on or off-campus. For those that met on campus, the second most popular means was meeting in class. However, nobody indicated that they met their partner in a class off-campus. Only 5 percent of respondents indicated meeting their current partner through dating apps, compared to over 30 percent in the Class of 2025.
Student Life
A majority of students were on financial aid and satisfied with their package at Wellesley. Extracurriculars, including student organizations and work study jobs, occupied a significant portion of student life. The data reveals a tendency towards on campus parties, but a general disconnect from partying overall. Following trends from last year, Tower Court was the most popular dorm neighborhood.
60 percent of respondents said that they received financial aid. Out of those respondents, 60 percent said that they were satisfied with their financial aid package.
93 percent of respondents reported participating in on-campus student organizations. Among these, 45 percent participated in cultural organizations, 40 percent in music and performance groups, and 27 percent in academic subject-focused organizations. 11 percent of respondents reported participating in varsity sports, and almost 20 percent reported participating in a society.
34 percent of respondents reported spending 3 to 6 hours per week in their organizations, while 25 percent reported spending 7 to 10 hours.
59 percent of students reported doing a work study job. 84 percent of students on financial aid reported taking a work-study position, compared to 28 percent who were not on financial aid.
Overall, students reported moderate satisfaction with their social life, with an average rating of 3.5 out of 5. Students rated dorms, off-campus activities, campus organizations, and dining halls as the four most important aspects of their social life.
Respondents preferred to party on-campus as opposed to off-campus. On average, respondents partied on-campus “sometimes” and off-campus “rarely.” This reveals that the Class of 2026 did not party too much on average, and also did not party far more in one place compared to another. Dorm parties were the most common type of on-campus parties, while bars and clubs were the most common location for off-campus parties.
Nearly 52 percent of respondents reported Tower Court as their favorite residential neighborhood. Across all dorms, students did not report levels of extreme dissatisfaction. In parallel with Tower Court as the favorite residential neighborhood, students whose favorite dorm neighborhood was Tower Court reported the highest levels of satisfaction, followed by those whose favorite dorm neighborhood was the Quint.
Despite critiques about Munger, 3.4 percent of respondents said that Munger was their favorite dorm. One senior expressed their feelings towards the Hall in their hot take.
“Munger isn’t that bad,” they wrote.
Post-Graduation Plans
As the unemployment rate for recent graduates sits at 5.6 percent, higher than the national average of 4.3 percent, seniors are facing particular challenges in the job market this year. The survey respondents, most of whom are not immediately working after graduation, look ahead towards their post-Wellesley life.
At 48 percent, less than half of this year’s seniors are working immediately after graduation. Out of the 52 percent that are not working, the largest portion — at about 46 percent — are going to graduate school. About 21 percent of respondents are not yet sure about their next steps.
Among those who are working, tech was the most popular industry — at 26 percent — followed by finance and media, each at 14 percent.
56 percent of respondents believe that AI will harm their career prospects, 22 percent of respondents believe that it will have no impact and only 12 percent believe it will not help their career prospects.The remaining 9 percent had other opinions, with a majority stating they were not sure how AI would impact their career.
75 percent of respondents had a starting salary between $20,000 and $99,000. 13 percent of respondents are breaking $100,000 for their starting salary, while 7 percent reported doing unpaid work after graduation.
36 percent of respondents who majored in STEM had a starting salary of over $70,000, compared to 14 percent of non-STEM students.
Most respondents are not graduating with student loans: 73 percent of respondents reported not graduating with student loans, compared to the 27 percent that are. 32 percent of first generation or low income students (grouped as FGLI) reported graduating with student loans, compared to 25 percent of students who are not first generation or low income.
Only 6 percent of respondents will be located outside of the U.S. after graduation.
For the majority that are remaining in the U.S., the most popular cities are Boston, New York City, and Washington, D.C. 26 percent will remain in the Boston area, 16 percent will relocate to the New York City area, and 10 percent will relocate to the Washington, D.C. area. About 10 percent of respondents will move to California, with 5 percent locating in Los Angeles and 5 percent in the San Francisco Bay Area.
Wellesley Traditions
During their time at Wellesley, the institution’s long-standing traditions were well-attended by the Class of 2026. Looking back, most respondents said that they would choose Wellesley again, and looking forward, most respondents would donate to the College in some capacity. As the Class of 2026 bids their final adieu to the institution, they will miss everything from their friends to their professors.
Overall, almost every Wellesley tradition — aside from Step Singing — was attended by over half of the respondents. Marathon Monday (MarMon), Lake Day, and Flower Sunday were the most attended Wellesley traditions, each by over 95 percent of respondents. Drag, a more recently established student tradition, was also well-attended, by 81 percent of respondents.
While nearly 96 percent of respondents participated in Flower Sunday, only 20 percent are still in contact with their Flower Sunday Big.
70 percent of respondents said that they would choose to attend Wellesley again. This is a 14 percentage point increase from last year, where only 56 percent responded “yes” to choosing Wellesley again.
For one respondent who would choose Wellesley again, their hot take was that “People think the institution is worse than it is.” Another respondent who would choose Wellesley again and would donate said that “people need to chill out.”
10 percent of respondents said that they would not and 20 percent of respondents said that they maybe would choose Wellesley again.
For a respondent who said they would not choose Wellesley again nor donate to the institution, their hot take was that senior administration “is so incompetent it is actually jarring and concerning.” Another respondent who would not choose Wellesley again nor donate said that they were “pretty miserable socially,” despite originally thinking that they would “make connections.”
52 percent of respondents said that they would donate to Wellesley in some capacity. Of those respondents, 73 percent said that they would donate to specific departments, while the remaining 27 percent said that they would donate directly to the school. Wellesley’s $3 billion endowment is largely supported by alumni donations. Still, 48 percent of respondents said they either would not donate or were not sure if they would.
When we asked what seniors would miss the most about Wellesley, they mentioned everything from the people to the campus to the academics. The most popular word was “friends,” mentioned in 27 percent of the responses. The second most popular was “community,” at 11 percent, followed by “people,” at 10 percent.
“Being on this beautiful campus, the stars are so bright at night. And living close to friends, I can just knock on my friend’s door and talk about my day. And we could take a walk around the lake at sunset or walk around someplace at night and talk about all the stupid and fun things that happened in life and laugh it all out,” one senior said.
Another respondent further emphasized the community they’ve made on campus.
“The community I made here. Learning what true friendship was and having the opportunity to experience personal growth on such a beautiful campus,” another senior said.
Methodology
The News distributed the survey via social media and various email channels from April 12 to April 21. All questions were optional, meaning the sample size of each question may vary, and all data was self-reported.
To check for potential response bias, the News compared the demographics of our data to the official data from the Office of Institutional Research (OIR). According to the OIR, there were 525 members expected to graduate this May. Our survey received 124 responses, or a 23.6% response rate. Our sample overrepresented Asian and White seniors, by 20.9 and 14.7 percentage points*, respectively. Our sample also slightly overrepresented Native Hawaiian or Other Pacific Islander and American Indian or Alaska Native seniors by at least one percentage point*. Our sample slightly underrepresented Black seniors by 2.1 percentage points*.
*Percentage points is defined as the difference between two percentages.
Noufeesa Yahyaoui contributed to survey questions
Contact the editors in charge of this article: Lyanne Wang, Caitlin Donovan, Ruby Barenberg and Noufeesa Yahyaoui